OriginLab Corporation - Data Analysis and Graphing Software - 2D graphs, 3D graphs, Contour Plots, Statistical Charts, Data Exploration, Statistics, Curve Fitting, Signal Processing, and Peak Analysis      
Show: Category: Graph Type: Sort By:

Waterfall with Multiple Curves at Same Z Location
Read more...    More of same type...        More by same keywords...
Heatmap of CO2 Emissions
Read more...    More of same type...        More by same keywords...
Polar chart with log scale
Read more...    More of same type...        More by same keywords...
Stacked column plot with custom column labels.
Read more...    More of same type...        More by same keywords...
3D colormap surface and 2D line plot combined to illustrate the problem of measuring electrical impedance under adverse conditions.
Read more...    More of same type...        More by same keywords...
Line plot with error bars drawn in user-specified point increments.
Read more...    More of same type...        More by same keywords...
Piper diagram with TDS and point by point legend
Read more...    More of same type...        More by same keywords...
3D Scatter plot combined with 3D Parametric Surfaces
Read more...    More of same type...        More by same keywords...
Contour plot with labels
Read more...    More of same type...        More by same keywords...
Polar plot representing four dimensions: bubble size, color, direction and distance.
Read more...    More of same type...        More by same keywords...
Plot Stacked Contour Plots in a Cylinder Coordinates
Read more...    More of same type...        More by same keywords...
Color-filled contour plot with color scale representing matrix data, overlaid with white contour lines representing fit matrix.
Read more...    More of same type...        More by same keywords...
This graph portrays flood impact on the morphology of channels abandoned by rivers.  
It uses a Contour Color Fill plot to depict depth elevation and a Vector XYAM plot to show flow velocities.
This graph portrays flood impact on the morphology of channels abandoned by rivers. It uses a Contour Color Fill plot to depict depth elevation and a Vector XYAM plot to show flow velocities.
Read more...    More of same type...        More by same keywords...
Three intersecting surface plots with transparency
Read more...    More of same type...        More by same keywords...
This graph depicts the complexation of a peptide with copper.  Data was collected using a BioLogic Stopped-Flow Spectrometer system and imported into an Origin matrix
This graph depicts the complexation of a peptide with copper. Data was collected using a BioLogic Stopped-Flow Spectrometer system and imported into an Origin matrix
Read more...    More of same type...        More by same keywords...
Multi-panel plot shows experimental x-ray emission (XES) and absorption (XAS) spectra
Read more...    More of same type...        More by same keywords...
Stacked 100% bar plot with line+symbol overlay
Read more...    More of same type...        More by same keywords...
3D bar graph with labels
Read more...    More of same type...        More by same keywords...
Scatter plot comparing a mathematical model with the actual kinematics of a pedestrian in a traffic collision.
Read more...    More of same type...        More by same keywords...
YBCO superconductor growth study using multiple sets of axes and one offset to display deposition pressure, annealing pressure, and the change in critical temperature over time.
Read more...    More of same type...        More by same keywords...
Rotational-vibrational transitions for first 5 R and P branches for isotopologues of HCl
Read more...    More of same type...        More by same keywords...
Grouped box chart with color indexed datapoint
Read more...    More of same type...        More by same keywords...
Waterfall plots from XYYY data with Z scale from custom parameter row.
Read more...    More of same type...        More by same keywords...
Light Propagation Through a Bulk-fill Composite in MOD Restorations
Read more...    More of same type...        More by same keywords...
Scatter plot displaying water column sampling locations in Massachusetts Bay, with legend showing sample details and station names.
Read more...    More of same type...        More by same keywords...
The number of clusters found by Atom Probe Tomography analysis in a nanometric volume
Read more...    More of same type...        More by same keywords...
Smith chart graphing impedence in transmission lines.
Read more...    More of same type...        More by same keywords...
3D Colormap Surface Plot representing the density of electronic states in a superconductor.
Read more...    More of same type...        More by same keywords...
Emission intensity plotted as a function of excitation and emission wavelengths.  In this surface plot, each peak corresponds to a different semiconducting nanotube structure.
Emission intensity plotted as a function of excitation and emission wavelengths. In this surface plot, each peak corresponds to a different semiconducting nanotube structure.
Read more...    More of same type...        More by same keywords...
Campbell diagram for checking coincidence of vibration sources with natural resonances.
Read more...    More of same type...        More by same keywords...
A 3D colormap surface plot with contour projection in the XY plane.
Read more...    More of same type...        More by same keywords...
3D surface to displays a 3D Sphere drawn with parametric equations.
Read more...    More of same type...        More by same keywords...
This graph displays differences between ?armonic Oscillator?and ?orse?potential energy functions and the resulting vibrational energies.
Read more...    More of same type...        More by same keywords...
Scatter plot showing the absolute efficiency of an HPGe detector
Read more...    More of same type...        More by same keywords...
Colormap Sunburst Plot for World Happiness Report
Read more...    More of same type...        More by same keywords...
XYZ contour plot of 30-year mean temperature for the month of January
Read more...    More of same type...        More by same keywords...
Weather History for Washington, DC in June, 2002 to 2013
Read more...    More of same type...        More by same keywords...
3D Colormap Surface plot generated from XYZ data
Read more...    More of same type...        More by same keywords...
The distribution of nanohardness of stainless steel cross-section
Read more...    More of same type...        More by same keywords...
Polar scatter plot with error bars
Read more...    More of same type...        More by same keywords...
Relative Electric Field Density
Read more...    More of same type...        More by same keywords...
Stacked histogram plots illustrating a normal distribution with a peak curve overlay.
Read more...    More of same type...        More by same keywords...
Polar plot depicting temperature distribution near the North Pole.
Read more...    More of same type...        More by same keywords...
Bifurcation diagram for logistic map used in population studies under conditions of random migration.
Read more...    More of same type...        More by same keywords...
Circular contour plot depicting spatial activity patterns predicted by a computational model of the visual system of a housefly.
Read more...    More of same type...        More by same keywords...
Polar contour plot of semiconductor wafer thickness as a function of the radius in millimeters and the angle.
Read more...    More of same type...        More by same keywords...
Unicode Symbol Scatter
Read more...    More of same type...        More by same keywords...
3D colormap surface plot with skipped lines and missing values.
Read more...    More of same type...        More by same keywords...
Surface plot with colormap values assigned from another matrix.
Read more...    More of same type...        More by same keywords...
Stacked 100% column plot with multi-line label and connect line
Read more...    More of same type...        More by same keywords...
3D Histogram graph from the bivariate data.
Read more...    More of same type...        More by same keywords...
Multiple-layer presentation of data from magnetic analysis of alloy powders.
Read more...    More of same type...        More by same keywords...
3D multiple colormap surface with transparent plane.
Read more...    More of same type...        More by same keywords...
3D suface displaying shapes of mountain before and after volcanic eruption
Read more...    More of same type...        More by same keywords...
Bubble + Color Mapped Plot depicting earthquake data, both magnitude (bubble) and depth (colormap).
Read more...    More of same type...        More by same keywords...
Column Plot with Color Scale
Read more...    More of same type...        More by same keywords...
Scatter plot depicting the isotope signature of N sources found in IAB iron meteorites.
Read more...    More of same type...        More by same keywords...
Contour plot depicting vertical wind velocities as a function of time and height, overlaid with a vector plot depicting wind speed and direction.
Read more...    More of same type...        More by same keywords...
Water isotope ratios plotted in a 2D scatter graph.
Read more...    More of same type...        More by same keywords...
Elevation contour plot with missing data and horizontal color bar
Read more...    More of same type...        More by same keywords...
Two polar contour plots overlaid with one polar chart.
Read more...    More of same type...        More by same keywords...
Individual contour plots on left side ovelayed with transparency on right side.
Read more...    More of same type...        More by same keywords...
3D waterfall graph
3D waterfall graph
Read more...    More of same type...        More by same keywords...
Polar contour with custom orientation and contour line
Read more...    More of same type...        More by same keywords...
Fan performance curve for a forward curved utility blower.
Read more...    More of same type...        More by same keywords...
3D Colormap Surface with Point Label
Read more...    More of same type...        More by same keywords...
AIDS vaccine research results depicted in a custom four-panel line and symbol plot.
Read more...    More of same type...        More by same keywords...
Ternary contour plot from worksheet with three data columns represented as ternary coordinates, and one column used to compute the contour.
Read more...    More of same type...        More by same keywords...
Spectroscopy data series based on frequency (specified by column long name), each plot is Amplitude vs Time.
Read more...    More of same type...        More by same keywords...
2D waterfall and scatter plot illustrating data from experimental condensed matter physics research.
Read more...    More of same type...        More by same keywords...
3D ternary surface with projection and label
Read more...    More of same type...        More by same keywords...
Ternary chart with gradient fill for layer background, and color mapping of data points using another dataset.
Read more...    More of same type...        More by same keywords...
Ternary contour plot with data point overlay
Read more...    More of same type...        More by same keywords...
3D surface plot from a matrix containing missing values.
Read more...    More of same type...        More by same keywords...
Polar scatter with radial axis start at non-zero
Read more...    More of same type...        More by same keywords...
Wire frame surface plot with transparency.
Read more...    More of same type...        More by same keywords...
Overlapped Bars
Overlapped Bars
Read more...    More of same type...        More by same keywords...
Contour plot illustrating the influence of two different agents on the survival rate of cryopreserved red blood cells.
Read more...    More of same type...        More by same keywords...
3D Scatter plot with drop line, showing the population of the United States
Read more...    More of same type...        More by same keywords...
Analyzing metal binding to proteins via HPLC coupled online to sector-field ICP-MS
Read more...    More of same type...        More by same keywords...
XYZ Contour plot with colormap from second Z and custom boundary
Read more...    More of same type...        More by same keywords...
Hyperbolic paraboloid from a virtual matrix
Read more...    More of same type...        More by same keywords...
Smart labeling with Y offest and special point
Read more...    More of same type...        More by same keywords...
Overlaid polar chart with custom radial axis
Read more...    More of same type...        More by same keywords...
Temperature over Time
Read more...    More of same type...        More by same keywords...
Multi-panel graph woth both 2D and 3D plots
Read more...    More of same type...        More by same keywords...
Overlay of two contour plots in one graph layer.
Read more...    More of same type...        More by same keywords...
Fill partial area between curves
Read more...    More of same type...        More by same keywords...
This graph shows the calculated optical density of states of a superlattice as function of the photon energy and the electric field.
Read more...    More of same type...        More by same keywords...
Phase Diagram for the Superconducting Compound
Read more...    More of same type...        More by same keywords...
Scatter Matrix Plot with Histogram in Diagonal Cells
Read more...    More of same type...        More by same keywords...
3D Surface Plot from Virtual Matrix with a contour plot projected onto xy plane
Read more...    More of same type...        More by same keywords...
Scatter Plot with Color and Size Mapping for Acoustic Emission Detection
Read more...    More of same type...        More by same keywords...
XY error bar plot showing uniformity of laminar nozzle velocity.
Read more...    More of same type...        More by same keywords...
3D scatter plot with error bars and 3D surface
Read more...    More of same type...        More by same keywords...
Two intersecting surface plots with transparency and different colormap
Read more...    More of same type...        More by same keywords...
Smart labeling attached to Y2 with vertical poly-leader-line
Read more...    More of same type...        More by same keywords...
Symbol plot with size and color mapped to XY data, and with transparency applied for improved visibility of overlapping data points
Read more...    More of same type...        More by same keywords...
Colormap Sunburst Plot
Read more...    More of same type...        More by same keywords...
Contour plot derived from XYZ worksheet data measuring ice temperature at different depths over time.
Read more...    More of same type...        More by same keywords...
3D Scatter with Colormap, scatter size proportional to another column (Engine Displacement)
Read more...    More of same type...        More by same keywords...
Population Bubble plot
Read more...    More of same type...        More by same keywords...
3D surface with error bar from another matrix
Read more...    More of same type...        More by same keywords...
TimeLine for Financial Crisis
Read more...    More of same type...        More by same keywords...
Colormapped Line Series
Read more...    More of same type...        More by same keywords...
Single-walled nanotube emission intensity plotted as a color-coded contour plot.
Read more...    More of same type...        More by same keywords...
Colormap surface and color contour graphs profiling differences in body heat transfer.
Read more...    More of same type...        More by same keywords...
Column chart with Custom Labels
Read more...    More of same type...        More by same keywords...
Crime rate comparison all over the United States with a bubble scale
Read more...    More of same type...        More by same keywords...
With the new Treemap Plot app, you can now create treemap plot with custom order and coloring in Origin or OriginPro.
Read more...    More of same type...        More by same keywords...
Contour plot with major and minor levels filled and Rainbow palette applied.
Read more...    More of same type...        More by same keywords...
3D ternary surface with projection
Read more...    More of same type...        More by same keywords...
Multiple panel scatter graph showing water isotope ratios for D/H, 18O/16O, and 17O/16O in and out of cirrus clouds.
Read more...    More of same type...        More by same keywords...
Overlay of two contour plots.
Read more...    More of same type...        More by same keywords...
3D Waterfall with additional plane
Read more...    More of same type...        More by same keywords...
Three datasets plotted as lines with error bars and semi-transparent fill areas.
Read more...    More of same type...        More by same keywords...
Particle analysis study represented in two-panel column/bar graph with inset plots
Read more...    More of same type...        More by same keywords...
Bubble Plot of Murder Rate and Cigarette Use
Read more...    More of same type...        More by same keywords...
Fill Area Above and Below Curve
Read more...    More of same type...        More by same keywords...
Multiiple dot chart consisting of data points plotted on a simple scale.
Read more...    More of same type...        More by same keywords...
3D scatter plot showing two drilling locations and several drill samples taken at those drilling locations.
Read more...    More of same type...        More by same keywords...
Calculated resonant X-ray scattering intensity from nickel oxide
Read more...    More of same type...        More by same keywords...
3D bar graph of matrix data with transparency,  where the matrix Z values are used for the colormap.
3D bar graph of matrix data with transparency, where the matrix Z values are used for the colormap.
Read more...    More of same type...        More by same keywords...
Grouped scatter plot with X offset and error bar
Read more...    More of same type...        More by same keywords...
Surface plot with symbols and drop lines to surface
Read more...    More of same type...        More by same keywords...
Fill area between curves, both above and below
Read more...    More of same type...        More by same keywords...
Line and symbol plots showing the results of laminar flow nozzle design.
Read more...    More of same type...        More by same keywords...
Double-Y column graph with gap across layers to avoid overlapping columns
Read more...    More of same type...        More by same keywords...
Map Combining Line and Contour Plots
Read more...    More of same type...        More by same keywords...
Fill area plot with vector overlay
Read more...    More of same type...        More by same keywords...
Smith chart graphing impedence in transmission lines.
Read more...    More of same type...        More by same keywords...
Wind speed and direction over time represented in a windrose diagram.
Read more...    More of same type...        More by same keywords...
Box chart of temperature data with scatter plot and distribution overlay.
Read more...    More of same type...        More by same keywords...
The radar chart is used primarily for data comparison.
Read more...    More of same type...        More by same keywords...
2D Kernel Density Plot
Read more...    More of same type...        More by same keywords...
Two intersecting surface plots with transparency and different color fill.
Read more...    More of same type...        More by same keywords...
Home Price Index Changes & Unemployment Rate
Read more...    More of same type...        More by same keywords...
This 3D colormap surface and bottom contour projection graph shows the emission of Ne IX ions from a very hot and dense plasma in a Z-pinch device.
Read more...    More of same type...        More by same keywords...
Contour plot with geographical data representing the part of total solar radiation that is reflected by the Earth
Contour plot with geographical data representing the part of total solar radiation that is reflected by the Earth''s surface.
Read more...    More of same type...        More by same keywords...
Land Surface Temperature
Read more...    More of same type...        More by same keywords...
Contour plot showing US voters arranged on a two-dimensional policy space, with the Y-axis representing social values (higher = more liberal), and the X-axis representing economic values (higher = more conservative).
Read more...    More of same type...        More by same keywords...
Gradient Filled 3D Colormap Bar
Read more...    More of same type...        More by same keywords...
I-Shaped box chart with overlapped data point
Read more...    More of same type...        More by same keywords...
Vector plot illustrating the effect on river water flow of two differently shaped pylons.  A color graph adds magnitude as a fourth dimension.
Vector plot illustrating the effect on river water flow of two differently shaped pylons. A color graph adds magnitude as a fourth dimension.
Read more...    More of same type...        More by same keywords...
Contour color fill graph of the short-time Fourier transform of Doppler data.
Read more...    More of same type...        More by same keywords...
This geographic over/under chart represents a hypothetical investment portfolio.
Read more...    More of same type...        More by same keywords...
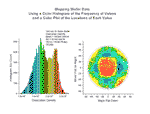
These two graphs display data from a study of dislocation densities on disk-shaped semiconductor wafers.  The first graph is a histogram generated from data stored in multiple worksheets.  The second graph is a scatter plot of the location of a measured value on the wafer.
These two graphs display data from a study of dislocation densities on disk-shaped semiconductor wafers. The first graph is a histogram generated from data stored in multiple worksheets. The second graph is a scatter plot of the location of a measured value on the wafer.
Read more...    More of same type...        More by same keywords...
© OriginLab Corporation. All rights reserved.
× _ Let's Chat